Internet working: What actually happens when you hit Enter on a URL

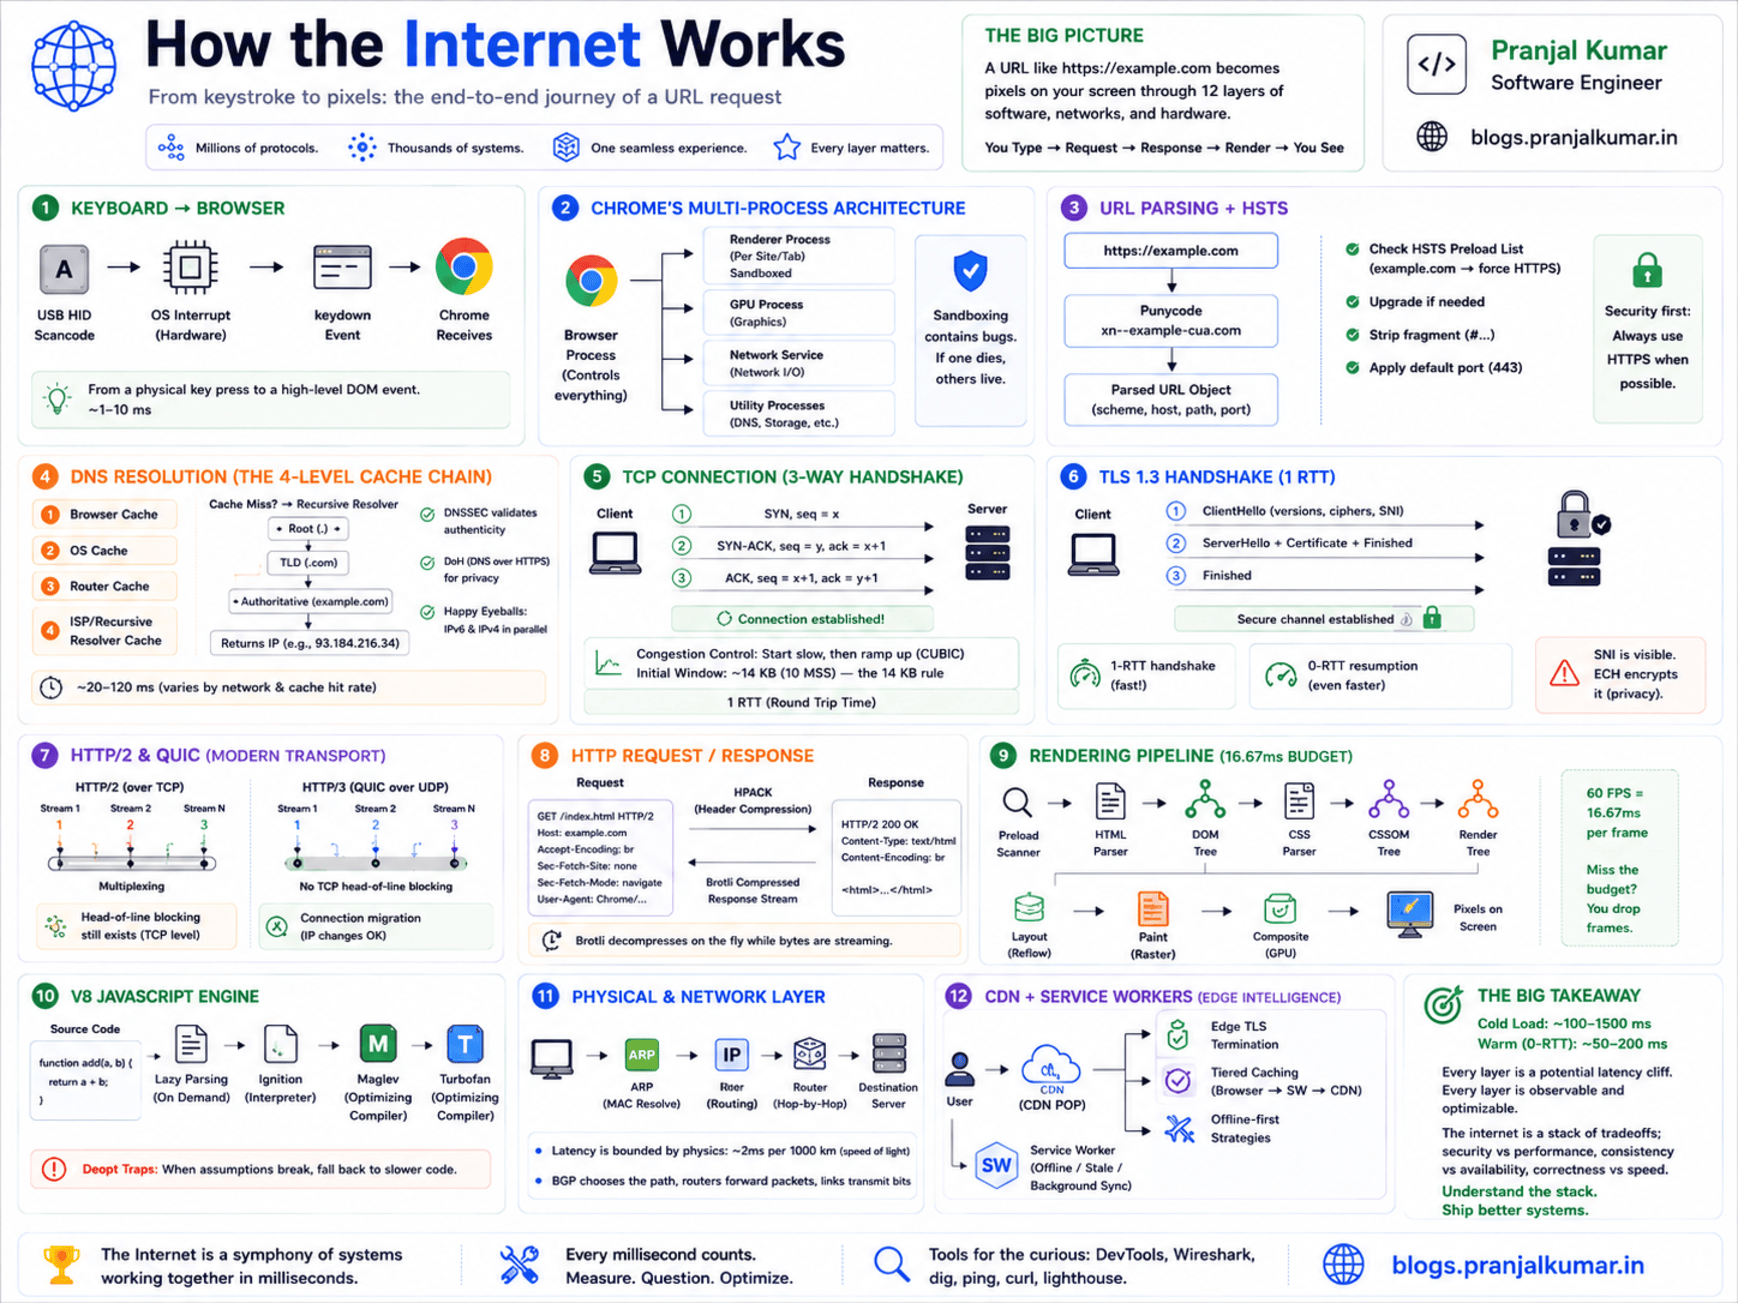
Every time I read a "how the internet works" article, I cringe - they all stop at DNS → TCP → HTTP → HTML. That's like explaining a car engine by saying "fuel goes in, wheels spin." Super helpful when the engine is on fire.
This post is what I wish someone had handed me when I was staring at a waterfall chart at 3 AM, wondering why a page took 4 seconds to load on a 1 Gbps connection. We're going to trace every system boundary crossing - from the electrical signal your keyboard fires to the GPU draw call that lights up the final pixel.
The keyboard interrupt (yes, it starts here)
You press Enter. That's a physical key-switch completing a circuit on a matrix scan. Your keyboard's microcontroller detects the state change, debounces it (~5 ms), and sends a USB HID scancode (0x28 for Enter) over the USB bus.
The host controller raises a hardware interrupt (IRQ). The kernel's USB HID driver picks it up, translates the scancode to a virtual keycode, and enqueues a KEY_ENTER event into the input subsystem (/dev/input/eventN on Linux, IOKit HID on macOS, Raw Input on Windows).
The window manager dispatches this as a keydown event to your browser. The browser's UI thread captures it, recognizes you're in the URL bar, and kicks off navigation. Chrome's NavigationController fires and the network stack starts work before the UI thread finishes its current animation frame. They're racing against your perception of speed.
Chrome's multi-process architecture
Before we go further, here's Chrome's process model - it shapes everything that follows:
┌─────────────────────────────────────────────────────────┐
│ Browser Process (1 per Chrome instance) │
│ - UI thread (address bar, tabs, bookmarks) │
│ - Network Service (DNS, TCP, TLS, HTTP - all of it) │
│ - Storage Service (cookies, cache, IndexedDB) │
├─────────────────────────────��────────────────────────────┤
│ Renderer Process (1 per site / site isolation) │
│ - Main thread (DOM, CSSOM, JS, Layout, Paint) │
│ - Compositor thread (layer tree, tile management) │
│ - Raster threads (pixel generation via Skia) │
├─────────────────────────────────────────────────────────┤
│ GPU Process (1 shared across all renderers) │
│ - Composites layers from all renderer processes │
│ - Issues GL/Vulkan/Metal draw calls │
└─────────────────────────────────────────────────────────┘
When you press Enter, the Browser Process owns the entire navigation until the first response bytes arrive. Only then does it spin up (or reuse) a Renderer Process and hand off the byte stream. This is a security boundary - the renderer is sandboxed and can't touch the network directly. Every fetch goes through the Browser Process via IPC.
This also explains site isolation: each cross-origin site gets its own renderer process with its own V8 isolate. A malicious script on evil.com literally cannot read memory from bank.com's renderer because they're separate OS processes.
URL parsing and the HSTS check
Now the browser has a string: https://example.com/path?q=1. You'd think parsing a URL is trivial - and you'd be wrong. I've seen production bugs from URL parsing edge cases.
The browser runs it through URL parsing (RFC 3986): normalizes the scheme, Punycode-encodes IDN labels (münchen.de → xn--mnchen-3ya.de), percent-encodes illegal characters, and resolves the default port (443 for HTTPS).
Then, before any network I/O:
HSTS Preload check. Chrome ships a static preload list baked into the binary - domains that must always use HTTPS. If the domain is on this list and you typed http://, the browser internally redirects to https:// without sending a single plaintext byte to the network.
Status Code: 307 Internal Redirect
Non-Authoritative-Reason: HSTS
There's also the dynamic HSTS store: if the server previously sent a Strict-Transport-Security header, Chrome stored that policy. It's persisted at ~/.config/google-chrome/Default/TransportSecurity - just a JSON file. I once debugged a redirect loop that turned out to be a stale HSTS entry from a dev environment. Knowing this file exists saves you hours.
DNS resolution - the part nobody explains well
DNS is one of those things everyone thinks they understand. "It's like a phone book for the internet!" Sure. And a CPU is like a calculator. Technically correct, practically useless for debugging.
The local resolver chain
Before anything hits the network, the browser goes through a caching chain:
- Browser DNS cache - Chrome has its own (
chrome://net-internals/#dns) with per-record TTL. Negative caches (NXDOMAIN) are stored too. Chrome will happily cache a failure for minutes whiledigshows the record is fine. - OS stub resolver cache -
systemd-resolvedon Linux,mDNSResponderon macOS. /etc/hosts- still checked. I've seen senior engineers spend hours debugging DNS issues that turned out to be a forgotten entry from a hackathon two years ago.- Router/gateway cache - your home router usually runs
dnsmasqor equivalent.
If all miss, we go to the recursive resolver (let's say 8.8.8.8).
Recursive resolution
The stub resolver sends a UDP datagram (port 53). The recursive resolver performs the actual recursion:
Stub → Recursive Resolver (8.8.8.8)
  └─→ Root server → "Try .com TLD at 192.5.6.30"
      └─→ .com TLD server → "Try example.com NS at 93.184.216.34"
          └─→ Authoritative NS → "A record: 93.184.215.14, TTL: 86400"
In theory, that's 3 round trips. In practice, the recursive resolver has cached the root and TLD responses (hit billions of times daily), so you usually pay for only the final authoritative query. But on a cold resolver, you'll feel all three hops - that's why the first page load after changing DNS settings feels sluggish.
The modern DNS landscape
A few things worth knowing about DNS as it exists today:
DNSSEC validates the chain of trust from root → TLD → domain using signed records. A failed validation returns SERVFAIL - hard error, not a redirect.
DNS-over-HTTPS (DoH) encrypts queries as HTTP/2 POSTs to providers like https://dns.google/dns-query. Your ISP can't see what you're resolving anymore, but it requires an existing TLS connection to the DoH provider (bootstrapped via hardcoded IPs).
Happy Eyeballs (RFC 8305) - my favorite name in networking. If both IPv4 and IPv6 records come back, the browser starts IPv6 first, gives it a 250ms head start, then races it against IPv4. Whichever SYN-ACK arrives first wins. Users shouldn't suffer because their ISP's IPv6 is half-broken.
TCP - the handshake tax
TCP was designed in the 1970s and still causes performance headaches its creators never imagined.
The three-way handshake
Client → Server:  SYN (seq=x), Window Scale, MSS, SACK Permitted, Timestamps
Server → Client:  SYN-ACK (seq=y, ack=x+1), Window Scale, MSS, SACK Permitted
Client → Server:  ACK (ack=y+1)
Cost: 1 RTT. For a US West → Europe server, that's ~150 ms before any data flows.
The options negotiated during SYN matter more than people think:
| Option | What it does |
|---|---|
| Window Scale | Allows receive windows > 64KB (max 1 GB window) |
| MSS | Maximum Segment Size - typically 1460 bytes for Ethernet |
| SACK | Selective Acknowledgments - smarter retransmission |
| ECN | Explicit Congestion Notification - routers signal congestion without dropping packets |
Congestion control - the hidden performance governor
After the handshake, the kernel's congestion control algorithm dictates how fast data flows. This will fundamentally change how you think about web performance.
- Initial congestion window (IW): Typically 10 segments (14.6 KB). This means the first flight of data after the handshake carries at most ~14.6 KB. Your entire first impression of a website must fit in that or you're paying another round trip.
- Slow start: cwnd doubles every RTT until packet loss or threshold.
- BBR models bandwidth and RTT explicitly instead of reacting to loss - significantly better on mobile/lossy links.
If your critical CSS is 30 KB, you're paying an extra RTT - maybe 100+ ms on a cross-continent connection - just because you shipped 15 KB too much CSS. This is why the "14 KB rule" exists, and why every byte in your critical path matters far more than raw bandwidth suggests.
Connection pooling
Browsers maintain up to 6 TCP connections per origin (HTTP/1.1). With HTTP/2, everything multiplexes over a single connection, amortizing the handshake cost across all requests.
TLS 1.3 - the crypto handshake
I've spent more hours staring at TLS handshake failures than I'd like to admit. TLS 1.3 collapsed the handshake from 2 RTTs (TLS 1.2) to 1 RTT by doing key exchange and authentication in the same flight:
Client → Server:  ClientHello
                  + key_share (X25519 ECDH public key)
                  + server_name (SNI: "example.com")
                  + ALPN (h2, http/1.1)

Server → Client:  ServerHello + key_share
                  {EncryptedExtensions}
                  {Certificate}
                  {CertificateVerify}
                  {Finished}

Client → Server:  {Finished}
                  [Application Data starts HERE]
Both sides derive traffic keys from the shared ECDH secret via HKDF. All data is now encrypted with AES-256-GCM or ChaCha20-Poly1305.
The SNI privacy problem
Here's a dirty secret: the server_name extension (SNI) is sent in plaintext in the ClientHello. Any network observer - your ISP, a corporate proxy, a nation-state firewall - can see which domain you're connecting to, even though the content is encrypted. Encrypted Client Hello (ECH) fixes this by encrypting the ClientHello under a public key from the domain's DNS HTTPS record.
0-RTT resumption
If the client previously connected to this server, it may have cached a PSK from the server's NewSessionTicket. On reconnection, it sends application data with the ClientHello - zero round trips for TLS.
The catch: 0-RTT data is replayable. An attacker who captures the ClientHello can replay it. This is why only idempotent requests (GET) go in 0-RTT, and servers need anti-replay mechanisms.
Certificate validation
The chain is validated: leaf cert → intermediate(s) → root CA in the OS trust store. Chrome uses CRLSets (a compressed revocation list pushed via component updates) instead of slow online OCSP checks, and requires Certificate Transparency SCTs to prevent rogue CA issuance.
HTTP/2, HTTP/3, and QUIC
We finally have an encrypted pipe. Now let's shove data through it.
HTTP/2 multiplexing
HTTP/2's killer feature: multiple request/response pairs share a single TCP connection as independent streams. No more 6-connection limit.
But here's the cruel irony - TCP delivers bytes in order. If one segment is lost, all streams stall waiting for retransmission. Your CSS stream is held hostage by a lost packet from the JavaScript stream. This head-of-line blocking drove the creation of QUIC.
HPACK compresses headers using a static table of common values plus a per-connection dynamic table. The second request to the same origin typically sends ~20 bytes of headers instead of ~800 bytes.
HTTP/3 and QUIC
HTTP/3 runs over QUIC (RFC 9000) - reliable delivery rebuilt on top of UDP. When I first heard this, I thought it was insane. Then I read the design and realized it was brilliant:
- Per-stream ordering (not per-connection - no head-of-line blocking)
- Built-in TLS 1.3 (crypto handshake is part of the QUIC handshake)
- Connection migration - connections are identified by a Connection ID, not the IP/port 4-tuple. Switch from Wi-Fi to cellular? Connection survives.
| Protocol | RTTs to first byte |
|---|---|
| HTTP/1.1 + TLS 1.2 | 3 |
| HTTP/2 + TLS 1.3 | 2 |
| HTTP/3 (QUIC) | 1 |
| HTTP/3 0-RTT | 0 |
Browsers discover HTTP/3 via the Alt-Svc header. The first request always goes over TCP; subsequent requests migrate to QUIC if it works.
The HTTP request and response
What actually goes over the wire - not the textbook version:
GET /path?q=1 HTTP/2
:authority: example.com
:scheme: https
accept: text/html,application/xhtml+xml,application/xml;q=0.9,*/*;q=0.8
accept-encoding: gzip, br, zstd
sec-ch-ua: "Chromium";v="128"
sec-fetch-dest: document
sec-fetch-mode: navigate
sec-fetch-site: none
The Sec-Fetch-* headers are criminally underused. They tell the server the context of the request - and they're unforgeable (the browser sets them, not JavaScript). If you're building an API and not checking these, you're missing a free layer of CSRF defense.
The request hits a load balancer (Envoy, nginx), gets routed to an app server, which generates the response:
HTTP/2 200
content-type: text/html; charset=utf-8
content-encoding: br
cache-control: public, max-age=3600, stale-while-revalidate=86400
strict-transport-security: max-age=63072000; includeSubDomains; preload
content-security-policy: default-src 'self'; script-src 'self' 'nonce-r4nd0m';
The body is Brotli-compressed. The browser starts decompressing as chunks arrive - it doesn't wait for the full response. The HTML parser starts building the DOM while the last bytes are still in flight.
From bytes to DOM - the rendering pipeline
This is where most articles wave their hands and say "the browser renders the page." It's not one step. It's an absurdly complex pipeline.
Preload scanning
While the main HTML parser runs on the main thread, Chrome fires up a preload scanner on a separate thread. It scans ahead looking for resource URLs (<link>, <script src>, <img>) and kicks off network requests before the main parser reaches those nodes. If you bury a critical CSS <link> below a huge inline script, you've negated this optimization. I've seen this cost 500+ ms.
HTML parsing and DOM construction
Network bytes → Content decoding (streaming)
→ Character encoding detection
→ Tokenizer (state machine per HTML5 spec)
→ Tree builder
→ DOM Tree
The parser blocks on <script> tags without async or defer - pauses DOM construction entirely until the script is fetched, compiled, and executed. Every synchronous script in your <head> is a toll booth on the highway to first paint.
A <link rel="stylesheet"> blocks rendering (not parsing) - the browser won't paint until CSSOM is ready, because painting without styles causes a flash of unstyled content.
CSSOM and the layout tree
All stylesheets merge into a CSSOM. The DOM and CSSOM combine into a layout tree - elements with display: none excluded, pseudo-elements added, computed styles resolved.
Layout
The engine walks the tree and computes geometry. Block layout, inline layout, flex/grid constraint solving. This is where layout thrashing kills you - reading a layout property after modifying the DOM forces a synchronous reflow:
// BAD: forces layout on every iteration
for (let i = 0; i < 1000; i++) {
  el.style.width = el.offsetWidth + 1 + 'px';
}
Paint, composite, draw
After layout, Chrome records display items (draw commands). Then the page is split into layers (elements with will-change: transform, 3D transforms, <video>, <canvas>). Each layer is divided into tiles and rasterized by GPU threads into textures. Finally, the GPU process composites all layers together and submits the framebuffer.
On a 60 Hz display, this entire pipeline must complete in 16.67 ms. On 120 Hz, 8.33 ms. You have 8 milliseconds from a DOM change to photons. That's why UI frameworks obsess over minimizing re-renders.
JavaScript execution - V8's pipeline
When the parser hits a <script>, V8 takes over:
Lazy parsing: V8 only fully parses functions when they're called, not declared. If you ship a 2 MB bundle but only execute 200 KB on first load, V8 won't waste time parsing the rest upfront. This is why code splitting works.
Tiered compilation:
Cold code:    Ignition (interpreter)
Warm code:    Maglev (mid-tier compiler, ~10x faster)
Hot code:     Turbofan (full optimizing compiler, ~100x faster)
Turbofan does type specialization, inlining, escape analysis, and dead code elimination based on runtime feedback from Inline Caches.
Deoptimization is the trap: if Turbofan's type assumptions are violated, it bails out back to Ignition. I've seen this cause performance cliffs in production - code runs fast for an hour, then one edge-case input triggers a deopt and that function is 100x slower until re-optimized. This is why polymorphic call sites kill performance, and why TypeScript helps the JIT too.
The physical layer - ARP, IP, and photons
Your data needs to physically get from here to there.
ARP resolution: Before the first SYN leaves your machine, the kernel needs the MAC address of your router. It checks the ARP cache; if missing, broadcasts "who has 192.168.1.1?" and caches the reply.
IP routing: The kernel's routing table determines the next hop. The packet gets encapsulated: [Ethernet frame [IP packet [TCP segment [TLS record [HTTP/2 frame [payload]]]]]]
The physical journey: NIC → Ethernet/Wi-Fi → router → ISP backbone (fiber, DWDM links) → Internet Exchange Point → destination CDN/ISP → server NIC.
Light in fiber travels at ~200,000 km/s. NY→London (5,500 km) is 27.5 ms one-way at the speed of light - real-world is ~35-40 ms due to routing and signal regeneration. No amount of engineering can beat this. Physics doesn't care about your SLA. This is why CDNs exist.
CDN edge - cheating physics
For major sites, you don't hit the origin server. A CDN (Cloudflare, Fastly, Akamai) terminates your TLS connection at an edge PoP within ~10 ms of your location. The server you're talking to might be in a rack in your city.
The edge checks its cache, serves on hit (TTFB ≈ 10-30 ms), or fetches from origin on miss. CDNs use tiered caching - edge PoP → regional shield → origin - so most misses never reach your actual servers.
Edge compute is changing the game: Cloudflare Workers, Fastly Compute, and Lambda@Edge let you run code at the edge. Authentication, A/B testing, SSR - no round trip to origin.
103 Early Hints is underused magic: the CDN sends preload hints while waiting for the origin response, so the browser starts fetching CSS/JS before the HTML even arrives.
Service workers - the invisible middleware
If the site has a service worker registered, the request may never hit the network. Service workers intercept every request and can serve from cache, synthesize responses from IndexedDB, or implement any caching strategy you want:
self.addEventListener('fetch', (event) => {
  event.respondWith(
    caches.match(event.request).then((cached) => {
      if (cached) return cached;
      return fetch(event.request).then((response) => {
        const clone = response.clone();
        caches.open('v1').then((cache) => cache.put(event.request, clone));
        return response;
      });
    })
  );
});
The cost: if the SW thread is idle (~30s of inactivity), the browser must spin it up (50-100ms on mobile). Chrome's navigation preload fires the network request simultaneously while waking the SW, so you don't pay that penalty on the critical path.
Putting it all together - time budget
Here's a real navigation to https://example.com from a cold start:
| Phase | Time (typical) | Notes |
|---|---|---|
| Keyboard → browser | < 1 ms | Hardware interrupt |
| URL parse + HSTS | < 1 ms | In-memory |
| DNS resolution | 20-150 ms | Depends on cache state |
| TCP handshake | 10-150 ms | 1 RTT |
| TLS 1.3 handshake | 10-150 ms | 1 RTT (overlaps with TCP on QUIC) |
| Service worker | 0-100 ms | If registered; may skip network |
| HTTP request → first byte | 10-500 ms | Server processing |
| HTML download | 10-200 ms | Size + bandwidth |
| Critical CSS/JS fetch | 0-200 ms | Parallel, preload scanner |
| DOM + CSSOM + Layout + Paint | 15-150 ms | Complexity dependent |
| Total (cold) | ~100-1500 ms | |
| Total (warm, 0-RTT) | ~50-200 ms |
When things go wrong
The patterns that cause real outages:
Slow DNS - dns_start to dns_end > 100 ms in DevTools Timing. Fix: <link rel="dns-prefetch">, fast resolver.
TCP slow start penalty - first load slow, subsequent fast. Your critical path exceeds the 14.6 KB initial congestion window. Fix: keep HTML + critical CSS under 14 KB compressed.
TLS chain too long - extra RTT if the certificate message exceeds initial cwnd. Fix: short chains (leaf + 1 intermediate), ECDSA certs.
Render-blocking resources - gap between TTFB and First Paint. Fix: async/defer scripts, inline critical CSS.
Layout thrashing - long "Layout" blocks in Performance panel. Fix: batch reads/writes, requestAnimationFrame, CSS containment.
Where this is all heading
- QUIC everywhere - HTTP/3 adoption crossing 30%+. The TCP handshake tax is disappearing.
- ECH - SNI privacy becoming standard. Makes censorship harder.
- Shared dictionaries - Brotli/Zstandard with shared dictionaries could compress responses to 5-10% of current sizes for repeat visitors.
- Speculation Rules API - browsers pre-rendering entire pages based on declarative rules. Sub-100ms navigations as the norm.
- WebTransport - QUIC without HTTP semantics for real-time apps. Could finally kill WebSocket.
TL;DR
Keyboard IRQ → USB HID → OS input → Browser Process
→ URL parse → HSTS → DNS (cache chain → recursive resolution)
→ TCP SYN/ACK → TLS 1.3 key exchange
→ Service Worker → HTTP/2 request → CDN/origin → Response stream
→ Preload scan → DOM + CSSOM → Layout → Paint → Composite → GPU → Pixels
Every arrow is a potential latency cliff. Every one is debuggable. And now you know where to look.
The internet is not magic. It's layers of engineering held together by RFCs, backwards compatibility, and the stubbornness of protocol designers who refuse to accept "good enough."
Next time your page loads slowly, open DevTools. Look at the waterfall. Ask: which layer is bleeding time? DNS? TCP slow start? Render-blocking script? Layout thrash? You now have the mental model to answer that.
Your scalpels: Chrome DevTools Network panel (timing breakdown), Performance panel (frame analysis), chrome://net-internals (socket pools, DNS cache, QUIC sessions), and WebPageTest (real-device global testing).